The RevControl dashboard is the first thing you see when you log in. It is designed to display the most relevant and important information at a glance through five widgets, alerts, and a compact version of the rate calendar.
Widgets and Features on the Dashboard
Adjusting Widget Order
The default order of the widgets is:
- Business on the Books
- Pickup
- Actuals
- Competitors
- Budget
You can adjust the order by clicking on the small gear icon at the top right of your screen (next to “Alerts”). Drag the titles to change the order or move widgets to “Hidden” to hide them.
Changing Date
You can change the date at the top left of the screen. This will immediately refresh all widgets, except for the Actuals widget, which has its own date selector because it looks at historical data.
Detailed Descriptions of Widgets
Alerts
Alerts warn you of significant changes in demand, such as pickup alerts, or missing settings like Minimum rates or Occupancy supplements.
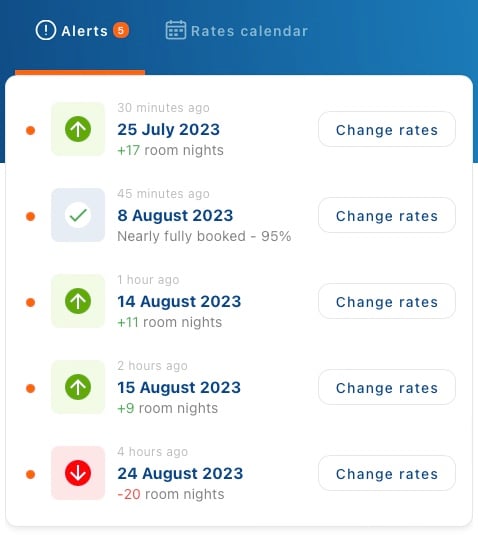
Clicking on a Pickup alert opens the “Change rates” pop-up. Here you can:
- Accept RevControl’s rate recommendation (shown in blue)
- Add a Minimum Length of Stay (MinLOS)
- Lock the day by clicking “Lock,” preventing automatic rate updates
- View specific day details via the information button
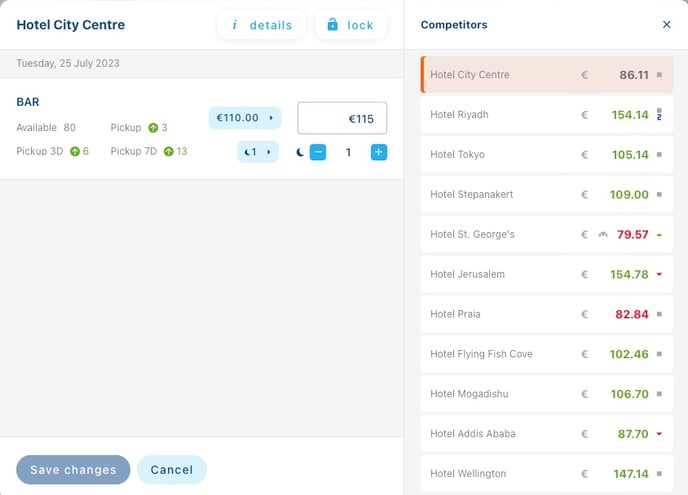
The pop-up also provides an overview of available room types and their associated rates. You can adjust rates by clicking on the arrows next to the rates or entering a new rate manually. The “Confirm all changes” button at the bottom of the pop-up must be used to save and publish all changes.
On the right side of the pop-up, competitor rates are displayed with indicators such as:
- Green or red: Indicates whether competitors are cheaper or more expensive than your hotel.
- Flame icon: Indicates non-refundable rates.
- Blue numbers: Indicate a Minimum Length of Stay (MinLOS).
- Croissant icon: Indicates the rate includes breakfast.
Triangles behind the prices show whether prices have increased or decreased since the previous day. Hovering over a rate provides more information about that specific rate, such as the room type and price change since the previous day.
These functionalities enable you to respond quickly to market changes and make strategic rate adjustments to improve your competitive position.
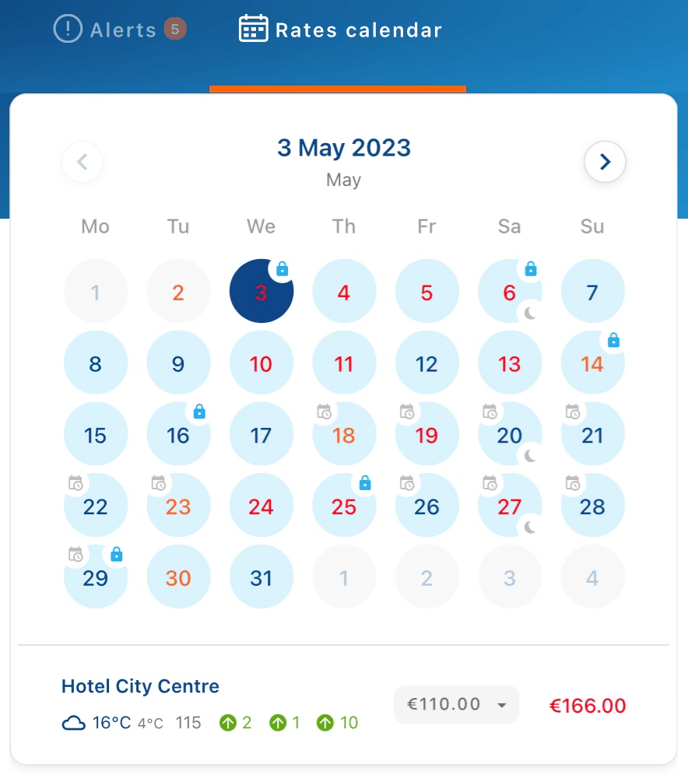
Rate Calendar
Next to the Alerts is a compact rate calendar displaying rates and MinLOS restrictions for the coming month. Clicking on a specific day reveals the rates, various KPIs such as occupancy rate and revenue, and any added events. Rates can be easily adjusted here.
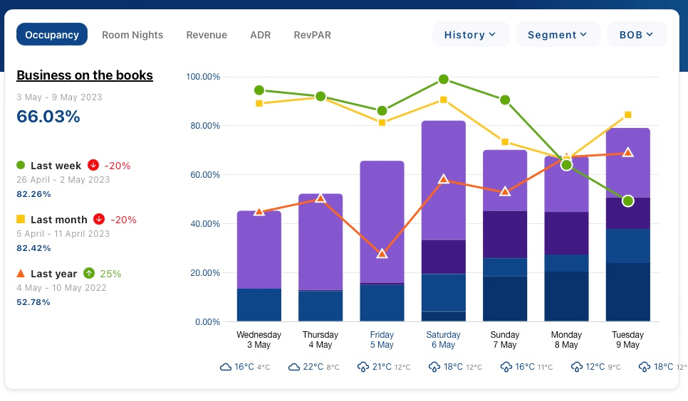
Business on the Books
This widget provides insight into the hotel’s current bookings for the next seven days. You can compare current figures with those from the previous week (green), month (yellow), and year (red) at the same point in the past. The top left allows you to switch between different KPIs, such as occupancy rate, room nights sold, revenue, ADR, and RevPAR. The top right allows you to toggle historical data and segments on and off. You can also switch the compared historical data from Business on the Books to Actuals.
Clicking on a specific day in the graph provides more detailed information, such as the distribution of segments and specific figures. For more extensive information over a longer period, you can click on the title to open the full Business on the Books report.
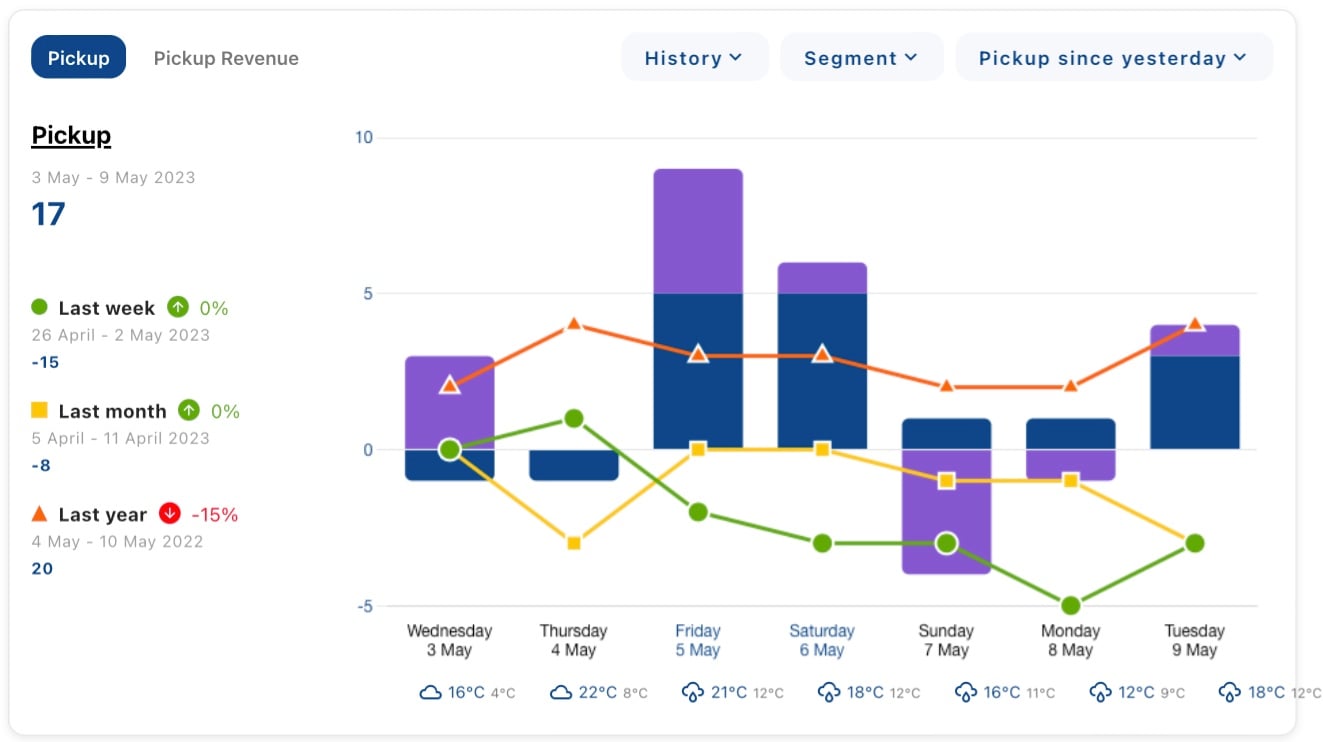
 Pickup
The Pickup widget shows bookings and cancellations for the next seven days. You can compare Pickup data with that from the previous week, month, and year. The focus here is on changes in bookings and cancellations over this period. The top left allows you to switch to Pickup in numbers or revenue. The top right allows you to toggle historical data and segments on and off. You can also change the measured period, such as Pickup since yesterday or the past thirty days.
Clicking on a specific day provides more detailed information, including the distribution of segments. For more details on Pickup, you can click on the title to open the Pickup Alert report.
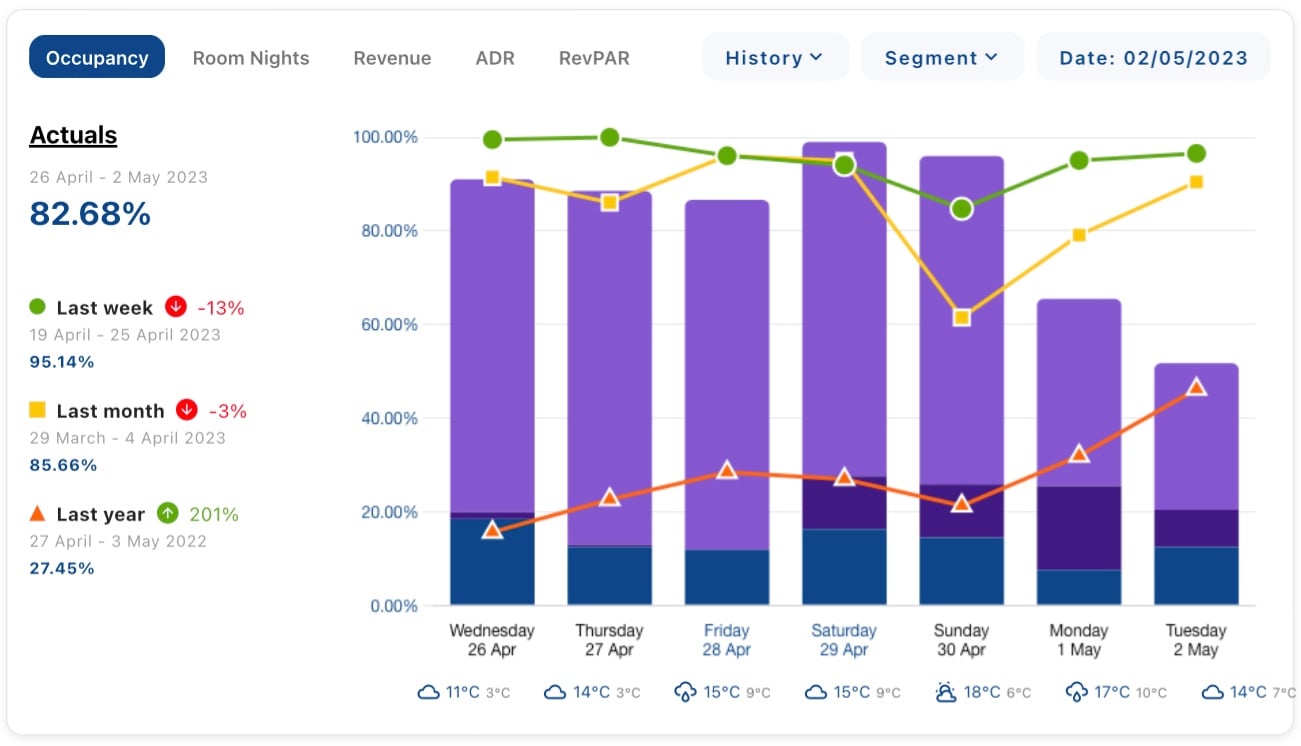
Actuals
The Actuals widget shows the actual performance of the hotel for the past seven days, compared to the same period last year, last month, and last week. The top left allows you to switch between different KPIs, such as occupancy rate, room nights sold, revenue, ADR, and RevPAR. The top right allows you to toggle historical data and segments on and off. You can also select a different date in the past.
Clicking on a specific day provides more detailed information. For more details on the hotel’s actual performance, you can click on the title to open the Business on the Books report. Dates with a small * indicate historical data, or Actuals.
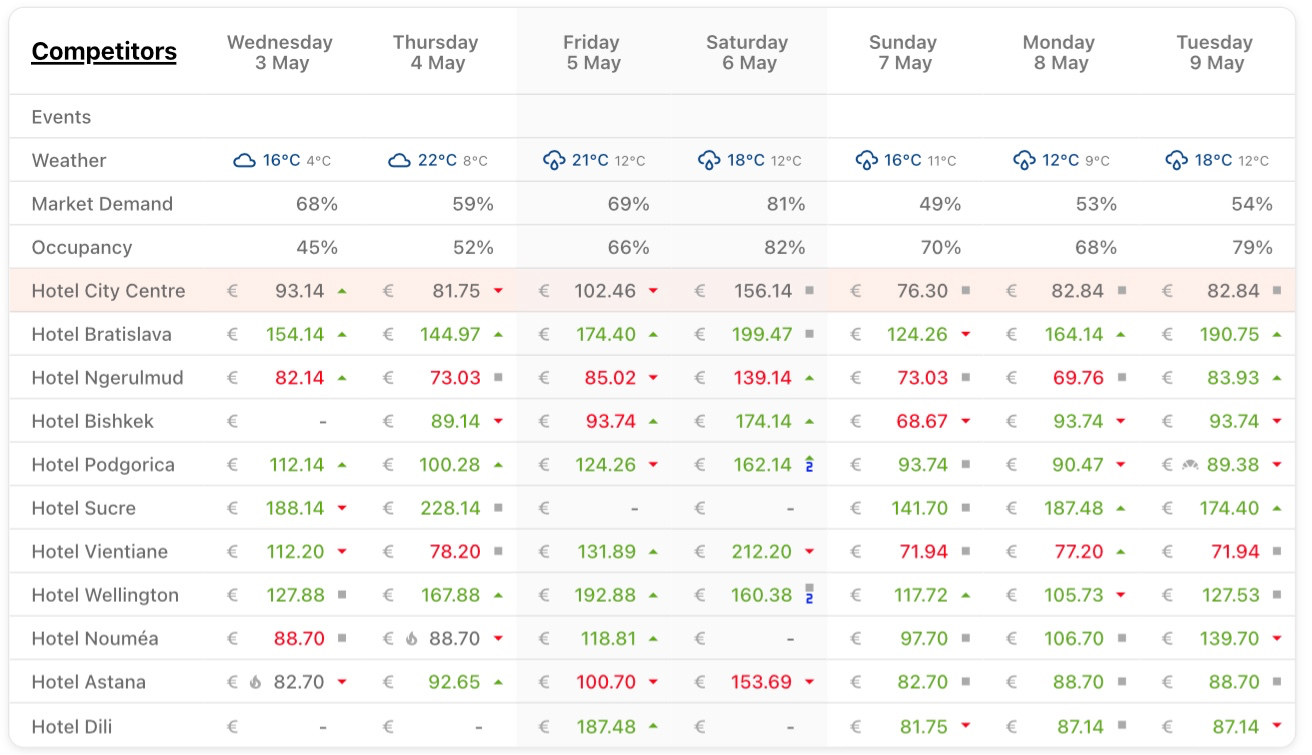
Competitors
This widget shows the competitor rates for the next seven days. It first displays added events, then the weather forecast, followed by Market Demand, and finally the Business on the Books occupancy rate of the hotel. Note that Market Demand is provided by our rate shopping partner and is not calculated by RevControl itself; these figures serve as indicative guidelines and not as expected occupancy.
On the left, the Competitor Set is displayed with the lowest bookable rates for the next seven days. Green prices mean competitors are more expensive, while red prices mean they are cheaper. A flame icon indicates non-refundable rates, blue numbers indicate a Minimum Length of Stay (MinLOS), and a croissant icon shows that the rate includes breakfast.
Triangles behind the prices show whether prices have increased or decreased since the previous day. Hovering over a rate provides more information about that specific rate, such as the room type and price change since the previous day.
Clicking on the title “Competitors” opens the Competitor Rates table, showing competitor rates for the coming year.
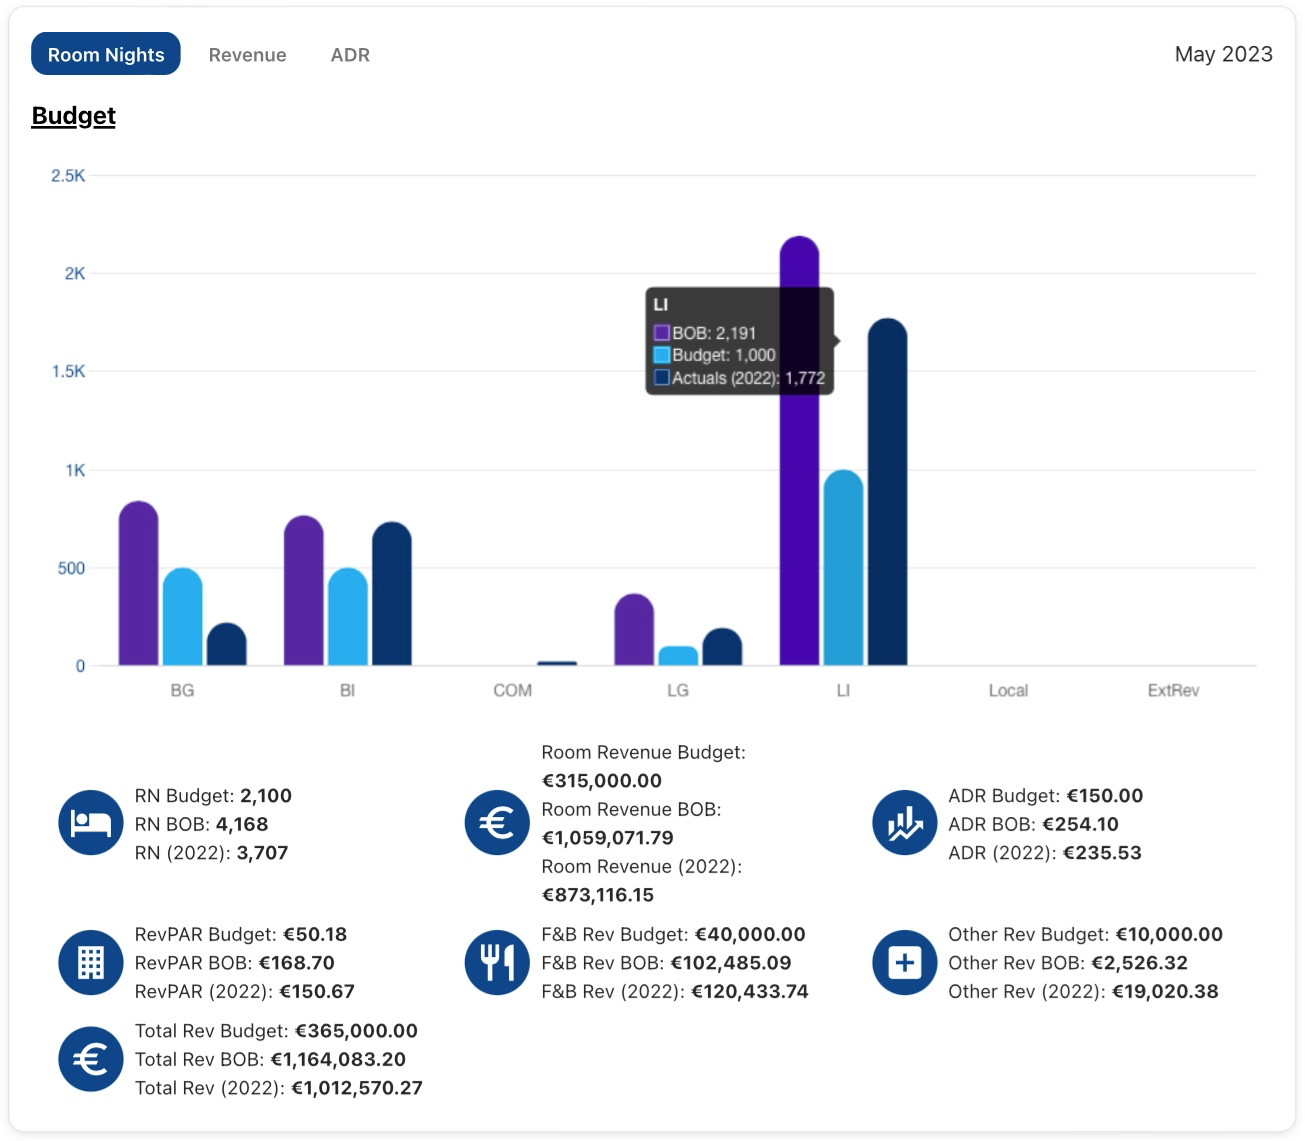
Budget
The final widget on the dashboard is the Budget. This is an optional feature in RevControl. The budget is not used in rate calculations but serves to check if targets are being met. The budget is visible in the information pages of the Rate Calendar. RevControl automatically compares last year’s results with this year’s Business on the Books. In the budget report, you can add additional targets. Clicking on the title opens the budget report.